Visualisation is a powerful tool that can help us remember more and learn faster. By turning facts and ideas into images in our minds, we can make information easier to understand and recall later. Our brains are naturally better at remembering pictures than words, so using visualisation gives us a clear advantage when we want to improve our memory.

When we use visual techniques, like drawing diagrams or picturing stories, we engage more of our senses and create stronger mental connections. This makes studying or learning new tasks less stressful and far more effective. With the right strategies, anyone can start using visualisation to make information stick.
Key Takeaways
- Visualisation boosts memory by making information more memorable.
- Using images and diagrams helps us learn and recall facts.
- Simple visual strategies can be used in everyday life to support learning.
The Science of Visualisation and Memory Retention

Memory retention is closely shaped by how our brains process and store information. Understanding how visualisation works can help us use mental images more effectively for learning and memory enhancement.
Cognitive Foundations of Memory
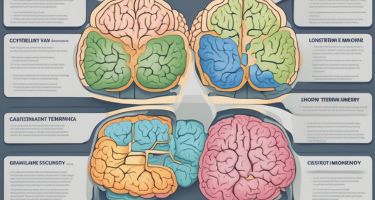
Our memory system is built on several different processes. First, we encode information, which means turning what we see, hear, or feel into something our brain can use. After that, our brains store this information for short-term or long-term use.
Long-term memory holds knowledge we want to remember for a long time, like facts and skills. To move information from short-term to long-term memory, we often need to review, relate, or use the information in meaningful ways.
Visualisation helps us in this process because it sparks different parts of the brain. When we create mental images, we use areas that handle both seeing and remembering. This dual use can make learning more effective.
How Visual Information Is Processed
The human brain is excellent at handling images. Studies have shown that up to 90% of information sent to our brains is visual. When we see an image, our visual cortex quickly sorts and stores details, making it easier to recognise and recall later.
Unlike words, which can be abstract or hard to picture, images create concrete scenes in our minds. This is why using diagrams, charts, and mental pictures can be powerful memory aids. Our brains process pictures up to 60,000 times faster than text, according to research.
By combining words with images (dual coding), we improve the chances that information will be stored in long-term memory. This technique is especially useful when trying to remember complex or detailed information.
Impact of Mental Images on Recall
Using mental images helps us recall information more easily. For example, we might picture a familiar room when learning a list of items—a method called the method of loci. This links what we want to remember with places we already know well.
Key reasons mental images boost recall:
- They reduce the amount of abstract information we need to remember.
- They trigger emotional responses, which can make memories stronger.
- They use both verbal and visual memory pathways, giving us more ways to retrieve information.
Visualisation techniques, like creating vivid, colourful mental pictures, make learning tasks more enjoyable and memorable. When we repeat these images, we reinforce pathways in the brain, making it easier to remember facts, names, or procedures long after first learning them.
Key Visualisation Techniques for Memory Enhancement

Using visualisation techniques can help us make abstract information concrete, organise ideas, and improve how easily we remember details. By creating mental images, using mind maps, and adding diagrams or graphics, we tap into the brain’s strength at recalling visual information.
Creating Effective Mental Images
Forming clear mental images enables us to attach information to something memorable. We can turn facts, dates, or concepts into pictures in our minds. For example, if we need to remember a shopping list, we might picture each item vividly: a loaf of bread bouncing, a shining apple, or milk spilling over.
Linking information to images with strong colours or unusual features can make details more memorable. It helps to use all our senses if possible, imagining not just the look but also the sound, feel, or smell. We can also create stories connecting these images to make them more meaningful. Research suggests that people who practise this technique often remember more than those who do not.
Mind Mapping for Organising Information
Mind maps are visual tools we use to organise thoughts around a central theme. We start with a main idea in the centre of a page and branch out with related keywords, facts, or smaller topics. Arrows, colours, and symbols can highlight connections and make the map more engaging.
This approach makes it easier to see the big picture as well as the details. Mind mapping can assist us in breaking down complex topics into manageable chunks, promoting better understanding and retention. Many students find that making their own mind maps helps consolidate learning and makes review sessions faster. It works well for organising notes from readings or revising before exams.
Utilising Diagrams and Graphics
Diagrams and graphics offer us a way to represent data, trends, or systems visually. We use charts, flow diagrams, or infographics to simplify complicated information. For example, a timeline helps us follow historical events, while a Venn diagram compares similarities and differences between concepts.
Graphics are especially helpful for visual learners, but everyone can benefit from them. Complex topics become easier to grasp when shown visually, reducing information overload. They help break up long texts and give our brains memorable anchors to recall key facts later. Using well-chosen graphics, we can avoid confusion and repeat or review information quickly.
Mind Maps versus Traditional Notes
Traditional notes usually follow a linear structure—lines of text, often in bullet points. Mind maps, by contrast, arrange information in a web, encouraging us to see relationships and connections between ideas. This encourages our brains to link facts, not just store them separately.
Studies have found that reviewing information through mind maps can support deeper understanding and better long-term recall than simply re-reading linear notes. Mind maps also make it easier to revise quickly, as we can see major topics and supporting details at a glance. However, some details may be lost if the map is not made carefully, so both formats have strengths for different needs.
Role of Visualisation in Educational Settings

Visualisation has become a valuable asset for schools and other educational environments. It transforms lessons by making complex ideas more accessible and easy to remember.
Benefits for Classroom Learning
In the classroom, visualisation supports children with different learning styles. Diagrams, charts, and images help all students grasp information that may be confusing if presented only in text. Visual aids can break down large or challenging topics into manageable pieces, reducing cognitive overload.
We also notice that interactive visuals encourage critical thinking. For instance, mind maps help students connect facts and ideas, not just recall information. Lessons with infographics or visual timelines often lead to higher engagement. When students are interested and focused, they tend to retain more of what they learn.
Key benefits:
- Improves attention and focus
- Makes lessons more engaging
- Simplifies complex concepts
Implementation in Teaching Strategies
To use visualisation effectively, educators blend images, videos, and graphics with traditional text. For example, maths teachers often use visual models like bar diagrams to solve word problems. Science classes benefit from animations that show invisible or abstract processes, such as cell division or circuit flow.
It is crucial to match visual tools to the target content and age group. Timelines, flowcharts, and labelled diagrams suit subjects such as history, biology, and literature. Teachers can encourage students to make their own visual notes or graphic organisers. We might use:
- Infographics for presenting statistics
- Interactive whiteboards for group discussions
- Iconography for quick reference
Tip: Combining visuals with short written explanations supports stronger understanding than using either alone.
Improving Long-Term Memory in Students
Visuals can strengthen long-term memory retention by helping students form connections between new and existing knowledge. When students see and interact with information—rather than just hearing or reading it—they are more likely to remember it later.
Studies show that visualisation activates different regions of the brain related to memory storage and recall. For instance, students taught vocabulary with images tend to remember those words longer than those who learn with text alone. Mnemonic devices like mind maps or storyboards allow students to organise and review information visually.
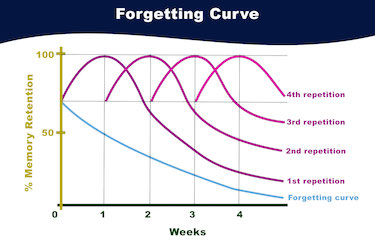
Teachers should review visual materials regularly. This spaced practice helps move knowledge from short-term to long-term memory. By using visual tools strategically, we support deeper learning and better recall.
Comparative Effectiveness of Visuals Versus Text

When we compare visuals and text, key differences can appear in how we retain and recall information. Research indicates that graphics are often more memorable than words, especially when we want to remember details for a longer time.
Graphics and Delayed Recall
Graphics play a significant role in strengthening long-term memory retention. Studies have found that information presented with images or diagrams is recalled more accurately and for a longer period than information given as plain text.
Children and younger learners seem to benefit the most. When we present a story or a lesson with pictures, it's not just the main idea that sticks. Details—like characters, events, or steps—are easier to recall days or even weeks later.
A simple table helps illustrate this point:
| Format | Immediate Recall | Recall After 1 Week |
|---|---|---|
| Text Only | Moderate | Low |
| Graphics | High | Moderate-High |
Graphics act as a kind of mental shortcut. They help us store and access information more efficiently, which explains why textbooks and online courses use so many visual aids.
Dual Coding Theory in Practice
Dual Coding Theory states that our brains process verbal and visual data using different mental channels. When we pair text with relevant graphics, both memory systems engage, making it easier for us to store and retrieve information.
For example, when studying scientific concepts with both diagrams and definitions, we often understand and remember the material better than using words alone. We can match terms with images, which strengthens our learning.
Not all visuals are equally effective, though. Charts, diagrams, and timelines that relate directly to the text give us the strongest boost in memory retention. Using both formats side by side allows us to build more connections in our minds, leading to deeper understanding and better recall over time.
Practical Strategies to Incorporate Visualisation in Daily Life
When we use visual aids, colour coding, and digital graphics, we can improve our memory retention in everyday situations. These strategies help us organise information and make it easier to recall when needed.
Visual Cues for Everyday Memory Tasks
Visual cues are simple prompts we can add to our daily routine to help us remember important tasks.
For example, we might place a sticky note on the front door to remind us to take out the rubbish. Using different symbols or pictures for specific chores or appointments can make them stand out in our minds. This way, we're less likely to forget key tasks.
We can also group similar items together based on visuals, such as keeping medication in a clear, labelled box. Simple graphics and icons make it easier to find what we need quickly. These small changes help train our brain to connect images with actions, boosting our memory.
Colour Coding and Visual Reminders
Colour coding is a popular visualisation technique for enhancing memory retention, especially for students and busy professionals.
We might use coloured folders or labels to separate different subjects or work projects. A table like the one below can help visualise how colour coding can be used:
| Colour | Category |
|---|---|
| Blue | Bills & Finance |
| Red | Medical Appointments |
| Green | Work/Projects |
| Yellow | Family/Personal |
Visual reminders, such as calendars with colourful stickers or highlighted deadlines, make important dates more noticeable. By using colours and eye-catching graphics, we draw our attention to tasks and information that matter most, making it easier to remember them.
Integrating Visual Tools with Technology
We can use digital tools to add effective visualisation techniques to our daily life.
Apps like digital calendars allow us to add graphics, icons, and colour-coded events. Setting photo reminders on our phones is another way to link images with important memories or tasks. Many educational apps use detailed illustrations and diagrams to support learning and boost memory retention.
When we use technology, we can customise our reminders with unique graphics and colours, making our digital environments more engaging and informative. This streamlines our schedules and makes recalling information much simpler.
Frequently Asked Questions
Visualisation uses our brain’s preference for images to help us remember information better. Visual details such as colour, layout, and imagery make learning more engaging and can support long-term memory.
How does incorporating imagery improve recall in comparison to text-only methods?
Images help us remember details because our brains process visual information quickly. When we pair words with pictures, we build stronger connections in memory.
Text-only methods often rely on repetition, but visual cues give us an extra anchor. Remembering both the look and meaning makes it easier to recall information later.
What are the cognitive mechanisms underlying the picture superiority effect?
The picture superiority effect happens because images get stored as both pictures and words in our memory systems. This double coding strengthens our ability to retrieve information.
We also find it easier to process complex ideas visually. Pictures often communicate meaning more clearly than words alone, leading to better recall.
In what ways can visual aids enhance the learning process for students?
Visual aids, like diagrams or mind maps, break down information into simpler pieces. They help us see relationships between ideas, making the material more understandable.
By adding images, flowcharts, and other graphics, we can stay focused for longer and remember key facts more easily.
What is the impact of colour usage on memory retention when presenting information visually?
Colour draws our attention to important information and helps us organise details. Bright and varied colours can make key points stand out, which improves memory retention.
Using different colours for related topics helps us remember how information is grouped, making it easier to retrieve later.
How does the complexity of visual representations affect their memorability?
Too much detail or clutter can make visuals hard to understand. Simple images are easier to remember and less likely to cause confusion.
Striking a balance is important. Visuals should be clear and highlight the most important information without including unnecessary extras.
What strategies can be employed to optimise the effectiveness of visualisations for long-term memory storage?
We can use mnemonics, repeating important images, and connecting visuals to real-life experiences. Creating our own images or diagrams helps reinforce learning.
Organising visuals by theme and spacing out review sessions can also build stronger long-term memory. Making visuals meaningful and relevant to the topic will help us remember them best.